A question I get quite often is “are today’s poker games more aggressive?“, and it’s a fair question. It seems like the average player is more aggressive than ever before, especially when you consider that only 5 years ago the games were incredibly passive. So I decided I would test some things myself and see if the games REALLY are more aggro, and if so…how much more aggressive? Since I have done a lot of poker database analysis for students I have a lot of databases and information on-hand. So I mashed up some databases and here are the results:

Given the data I had I decided to compare 2010-2011 and 2012-2013 hands. This seemed fair as it allowed me to gauge two different time periods and also ensure that I had enough hands to make the analysis worthwhile. I also only used 50NL full ring regular speed tables on PokerStars, since mixing speed tables and other sites might skew the data. Couple that with the fact that PokerStars is the biggest site in the world and the golden-standard of poker games…it made sense. In looking at these two databases I got 1.2 million hands from 2010-2011 and then 1.3 million hands from 2012-2013. This ensures that the sample sizes are close enough. However, I was shocked to see that over similar sample sizes there were 43k players in the 2010-2011 database…and only 9.5k in the 2012-2013 database!
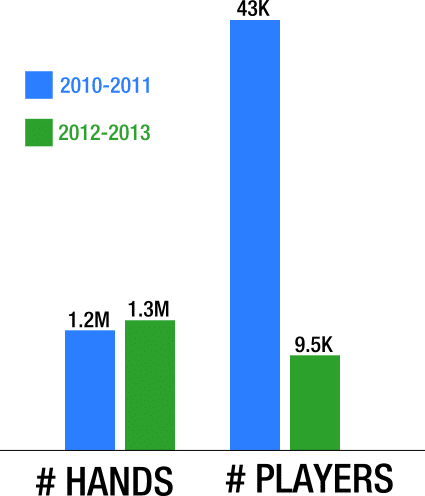
Notice that over similar sample sizes there were roughly 4.5x as many players in the earlier database, which is certainly influenced by Black Friday and market segmentation (France, Italy, etc.). It also goes to show you how much more reg-infested the games really are today. With more regs and less recreational players in the games, you are probably assuming that the games are a ton harder and aggressive today than in 2010-2011. Let’s find out…
Preflop Aggression
Let’s first start by checking out the VPIP and PFR of the overall databases. This considers each player’s stats equally, giving no weight to a single player’s volume.
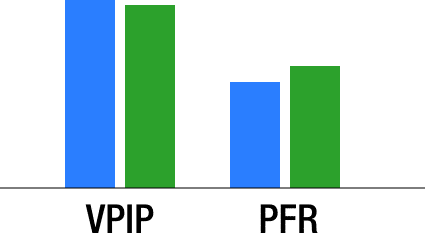
The VPIP between both databases was roughly the same (18.8% and 18.3% respectively). However, the PFR changed quite a bit going from 10.6% to 12.2%. This change was to be expected though, as recreational players tend to have fishier stats and regular players tend to have smaller gaps between their VPIP and PFR. So between the two databases there was a roughly 15% change in PFR, which is pretty sizable. But let’s see how this translated over to 3bet numbers…

Notice that across the board there was an advance in 3-betting numbers between 2010/2011 and 2012/2013. 3Bets went from 3.7 to 4.7 (a 27% increase), squeezes went from 3.4 to 4.1 (a 21% increase), and resteals went from 7.1 to 9.7 (a whooping 37% increase). This was to be expected, but not necessarily at this scale. Each 3bet number increased by at least 21% which is really huge when you think about it. It really goes to show you how important it is to know how to play against preflop 3bets, as you are obviously facing them more often. But how are players reacting when facing a 3bet preflop?

Both Fold v 3Bet and 4bet% raised, which of course means that Call v 3Bet naturally dropped. Again we are noticing more and more than passive actions are happening less often. And it should also be highlighted that 4bets went from 5% to 6.2%, resulting in a 24% increase from 2010/2011 to 2012/2013. That is pretty crazy if you think about it, although not surprising given the increased 3bet aggression. But I did want to go back one second and check out how players are stealing and reacting to steals…since we already looked at resteals earlier…
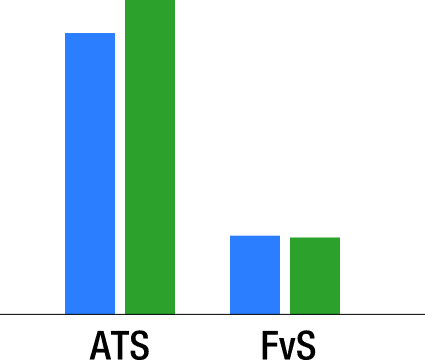
Attempt to Steal certainly raised going from 28.1 to 31.4 (a 12% change), but Fold v Steal didn’t really change all that much (going from 78.6 to 76.8). But what is important to note here is that if Fold v Steal is relatively the same, but resteal rose up by a significant margin, that call v steal actually dropped quite a bit. Yet again showing that passive actions are decreasing while aggressive actions are increasing across the board.
Postflop Aggression
To be thorough we also want to look at postflop stats and see if there were any changes. Let’s first start by looking at continuation bets and their success on a per street basis:
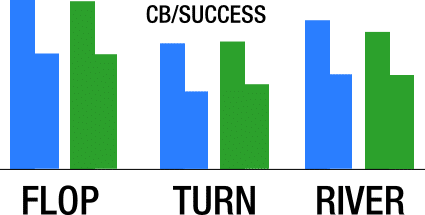
What this shows is the FlopCB and FlopCB Success, TurnCB and TurnCB Success, and also the RiverCB and RiverCB success. This includes both single raised and 3bet+ pots, but we will filter for just 3bet pots in a moment. The overall numbers and shapes are pretty similar for the flop and turn, but the RiverCB did drop from 58.9 to 54.3 (an 8% decrease). Another thing to note is TurnCB Success rose from 30.6 to 33.4 (a 9% increase), which means that players are folding a little more to TurnCBs in the more recent sample size. Given the fact that the FlopCB and TurnCB percentages are pretty much the same, and the FlopCB Success was roughly the same, I really didn’t expect to see a 9% increase in TurnCB Success. If the games are that much more aggressive, I would have expected to see either a sizable increase in TurnCB or a decrease in TurnCB Success (assuming the player pool would give less respect to TurnCBs and thus call or raise TurnCBs more often).
However, we do need to take preflop into consideration, remembering that the PFR did increase overall in the recent sample size. So if the PFR rose (meaning ranges are probably wider when they go postflop), and the FlopCB stayed the same, that means a weaker range is also getting to the turn. And since the TurnCB is similar, it means again that a wider range is probably raising preflop, CBing the flop, and then CBing the turn…making a 9% increase in TurnCB Success kind of surprising. However, it does make sense that the RiverCB would drop, given the weaker range that has preflop raised, CB, and TurnCB, and also been called on all streets thus far. But how do things look in 3bet pots?

I decided to only look at the FlopCB and TurnCB in 3Bet+ pots, given that river data would probably be too sparse to be useful. What we see here is roughly the same thing, with FlopCB and TurnCB data being very close in 3Bet+ pots. But, same as above, we need to take into consideration that the 3Bet % overall rose 27%, meaning that players are getting to the flop, and subsequently the turn, with weaker hand ranges. So since players are 3betting (and also 4betting) so much more often overall, it’s pretty impressive (and aggressive) that their FlopCB and TurnCBs are so close. Lastly, let’s look at postflop betting per street…which takes into account float/stabs, betting v missed CBs, etc.

Notice that across the board these numbers are up. The Bet Flop number rose from 38 to 41.9 (a 10% increase), Bet Turn rose 5%, and Bet River rose 1%. The Bet Flop percentage is obviously the most aggressive change, really showing how more apt players are to stab when a player misses their FlopCB. But if we think about it, given the VPIP/PFR gap change, which means that Call 2Bets decreased, it means a Call 2Bet range is stronger and thus able to get more value from their hand. I was expect the Bet Turn to increase more than just 5%, but I think players are getting to the turn with more SDV hands and thus checking behind and trying to get to showdown more often. This can be assumed from the smaller Call 2Bet range preflop (aka, stronger range) and the similar FlopCB Successes (still a stronger continuance-range).
“Reg” Aggression
To go a step further I wanted to analyze only players with at least 500 hands in each database. I thought this number was a decent indicator of a regular player versus a pure casual player, but it’s not perfect…
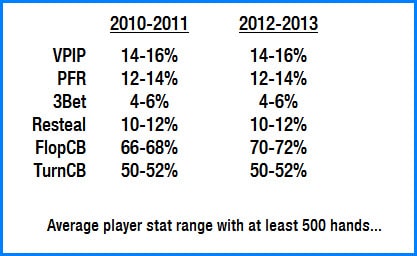
This chart shows the largest average stat range for players with at least 500 hands. So between 2010/2011 and 2012/2013 the most number of players with at least 500 hands had a VPIP between 14% and 16%. Much to my amazement, this trend was present in pretty much each stat that I checked. The only difference was the FlopCB, which raised slightly between the two databases, but notice again that the TurnCB was pretty much the same. I was really hoping to see more of a growth between the two databases, but alas, there wasn’t much of one for players with 500+ hands.
Conclusion
So are the games more aggressive today? I would say they certainly are. The overall PFR has risen shrinking the VPIP/PFR gap, 3bet numbers are increased across the board, and players are stealing more as well. And with wider aggressive preflop ranges it’s not shocking that players are backing them up with more aggressive postflop ranges. The recent player pool at large is continuation betting wider, both in single-raised and 3bet pots…and also stabbing more against whiffed CBs. But the more surprising thing is that while regs are more heavily dominating today’s games, they aren’t doing anything that crazy when it comes to their overall numbers. The overall stats are similar between yesterday’s regs and today’s regs, meaning the aggression shift is likely due to non-regs…or as the case seems to be…the lack thereof. When casual players decrease and non-regs become more competent, this kind of statistical shift isn’t surprising…but it’s important to understand when creating a profitable poker strategy.
(And just as an interesting fact: the average win-rate increased 12% from 2010/2011 to 2012/2013. Although that was going from -5.97bb/100 to -5.24bb/100 =) )
